When school leaders cobbled together emergency distance learning plans in March and April, they knew they were turning a blind corner. Would they reach all or even most of their students? Would students be invested in their schoolwork? Would uneven access to devices or the internet limit some students’ learning opportunities?
A pandemic that has driven students out of their schools is also thwarting mechanisms for measuring the impact of that disruption. When face-to-face schooling stopped, so did traditional attendance records, end-of-year tests and teachers’ daily observations of their students. Fortunately, the U.S. Census Bureau has stepped in with timely data to help educators and policymakers assess and address the pandemic’s impact. The data confirm fears that the pandemic squelched children’s opportunities to learn, but they also offer guidance for the months ahead.
In late April, the bureau launched a weekly Household Pulse Survey, which asks Americans how the COVID-19 pandemic has affected their lives. From June 4 through June 9, the survey focused on education in every state and 15 metropolitan areas. It asked households to reflect on the prior seven days:
-
- How much time did their children spend on learning activities?
- How much access did their children have to computers and the internet?
- Did the household have its own computers and internet access, or did it get them from schools or other sources?
- How did children receive their education — in their schools, online or through paper materials?
On June 17, the bureau released detailed Excel spreadsheets containing national, state and local results. (Scroll to the dashboard at the bottom of this post to explore select findings at the national and state levels, or dig into the spreadsheets to examine the full results.) Here are some broad themes that emerged from the data:
Limited time for teaching and learning. Households reported that, on average, household members spent roughly 8 hours on all teaching activities with their school-age children during the prior seven days. The average child spent 8 hours learning on her own, and another 3.4 hours in direct contact with teachers. Children typically spent less than 20 hours a week on any learning activities, below the minimum number of instructional hours required in at least 25 states. At the national level, there weren’t many consistent differences by race, ethnicity or income.
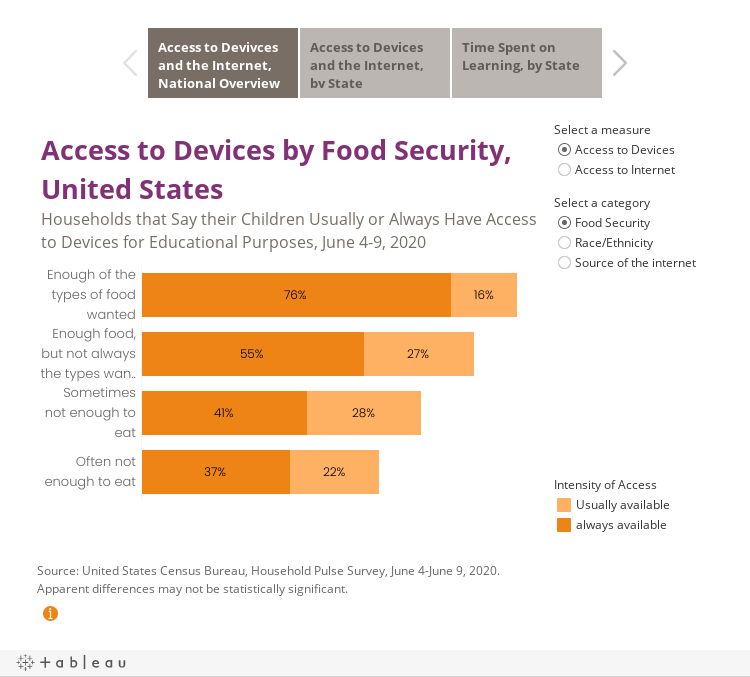
Uneven access to devices and the internet. Ninety percent of households said that the internet was always or usually available to children for educational purposes. Eighty-seven percent said that devices were always or usually available. Yet a closer look at the data reveals gaps by race, ethnicity, household income and access to food. For example:
-
- Roughly 75% of white and Asian households — but only about 65% of Black and Latino households — reported that their children always had access to the internet.
- Almost 90% of households earning at least $150,000 a year — but barely over 50% of households earning less than $35,000 a year — said their children always had access to devices.
- Among households that often don’t have enough to eat, only 40% reported that they always had access to the internet, and 37% reported similar access to devices.
- Just under 2.3 million households, or roughly 4% of all households, did not pay for their own internet access, receiving it instead from school districts, schools or other outside sources.
None of those data can reveal how effectively teachers or households spent their time on teaching and learning, but the data do expose barriers that keep learning from happening at all.
Lessons for states. The census data may help state assess and improve their efforts to close the digital divide, or to identify the students who need support, regardless of whether school buildings open in the fall. As states and school districts brace for the possibility of rolling school closures next year, government and industry may need to extend or even intensify efforts to provide free or subsidized internet and devices to those who need them most. Students who had the least access to learning resources during the shutdown may need to be first in line for face-to-face summer school or after-school programs, when they become available.
This year, education leaders had no choice but to conduct a vast experiment in distance learning without strong systems for observing its real-time effects on children and youth. The Census Bureau’s new data can shed light on its impact — and what states can do next.