
The National Assessment of Educational Progress, administered by the National Center for Education Statistics in the U.S. Department of Education, offers trend data that is comparable across states. NAEP is required by law to be administered every two years; however, it was postponed in 2021 because of the COVID-19 pandemic.
The results from the previous assessment in 2019 had already begun to reveal some troubling trends, with scores for fourth and eighth grade reading and eighth grade math significantly declining from 2017. Beyond national trends, gaps between student scores in the lowest and the highest achievement percentiles also increased significantly.
Due to disrupted learning brought on by the pandemic, these national trends accelerated in 2022. Both reading and math scores for fourth and eighth graders showed marked declines. Sharper declines were shown in some categories among students of color, female students, students from lower socioeconomic backgrounds and students who scored in the lowest achievement quartile.
Math Results
Nationally, scores for fourth grade math dropped by five points from 2019, and eighth grade math scores declined by eight points. These scores represent the largest decrease since NAEP began in 1990. At the state level, nearly all jurisdictions’ fourth grade scores decreased significantly from 2019. Forty-one states and the District of Columbia showed a decline, and nine states showed no significant change.
Significantly more students — 25% of all fourth graders — scored below the NAEP Basic achievement level. Forty-nine states and the District of Columbia showed significant declines in eighth grade scores, and 38% of all eighth grade students scored below NAEP Basic. Only Utah showed no significant change, and no states or jurisdictions showed increased math scores for either grade level.
Changes in NAEP Math Scores From 2019-22
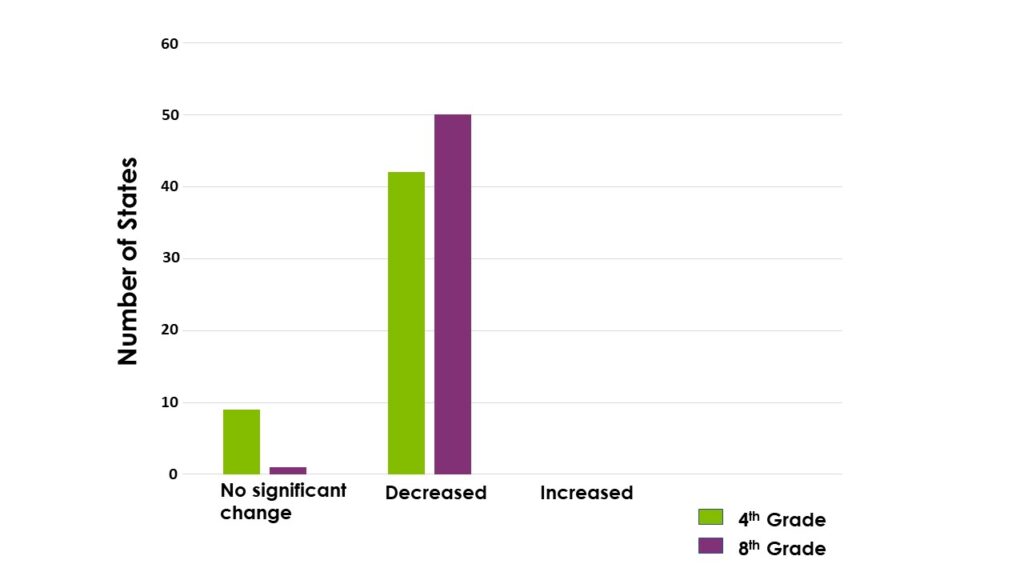
This is a vertical bar graph that shows the number of states that had no significant change, a decrease or an increase in fourth and eighth grade math scores from 2019-22.
Reading Results
Average national scores for fourth and eighth grade reading both declined by three points compared to 2019. These scores are identical to those measured in 1992, which is the first year the reading assessment was administered. Twenty-nine states and the District of Columbia saw decreases in fourth grade scores, while 21 states’ scores did not change significantly.
The number of students scoring below the NAEP Basic achievement level increased significantly from 2019, comprising 37% of fourth graders. Eighth grade scores declined in 33 states and showed no significant change in 17 states and the District of Columbia, including 30% of students scoring below NAEP Basic. As with math scores, no states showed increases for either grade level.
Changes in NAEP Reading Scores From 2019-22
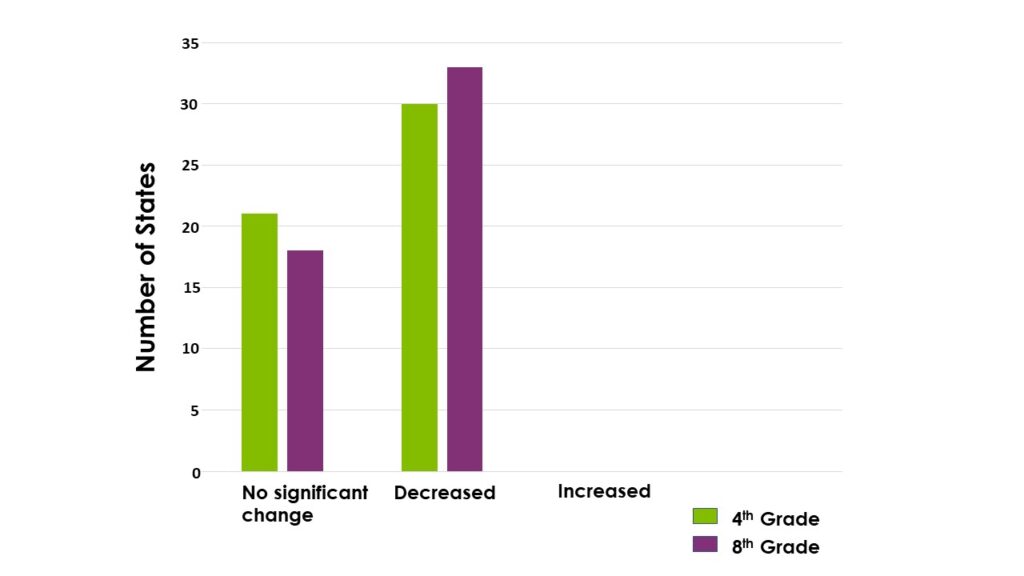
This is a vertical bar graph that shows the number of states that had no significant change, a decrease or an increase in fourth and eigth grade reading scores from 2019-22.
Student Subgroup Findings
While the findings suggest that most differences in performance between student subgroups have not changed significantly since 2019, education systems continue to show large disparities across grade levels for students of color, students from lower socioeconomic backgrounds and for emerging bilingual learners.
Looking at achievement levels for these subgroups, large portions of students are scoring below NAEP Basic. For context, nearly all states’ proficiency standards fall between the NAEP Basic and NAEP Proficient levels, which means that those students who score below NAEP Basic would likely score below the proficiency standards for their state assessments as well.
Percent of Student Groups Who Scored Below NAEP Basic Achievement Level
Fourth Grade
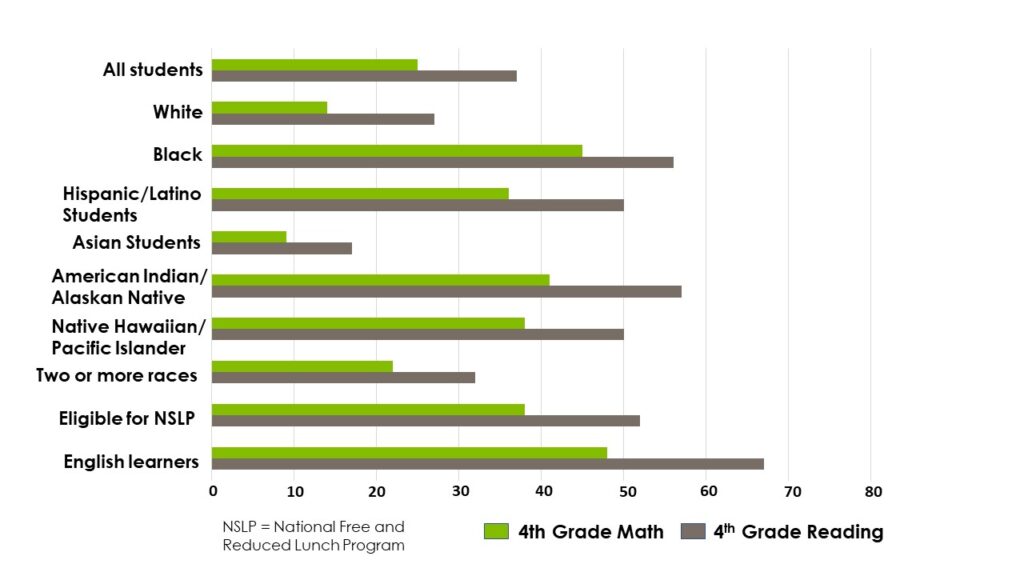
This is a horizontal bar graph that shows the percent of student groups who scored below the NAEP Basic achievement level in fourth grade math and reading.
Eighth Grade
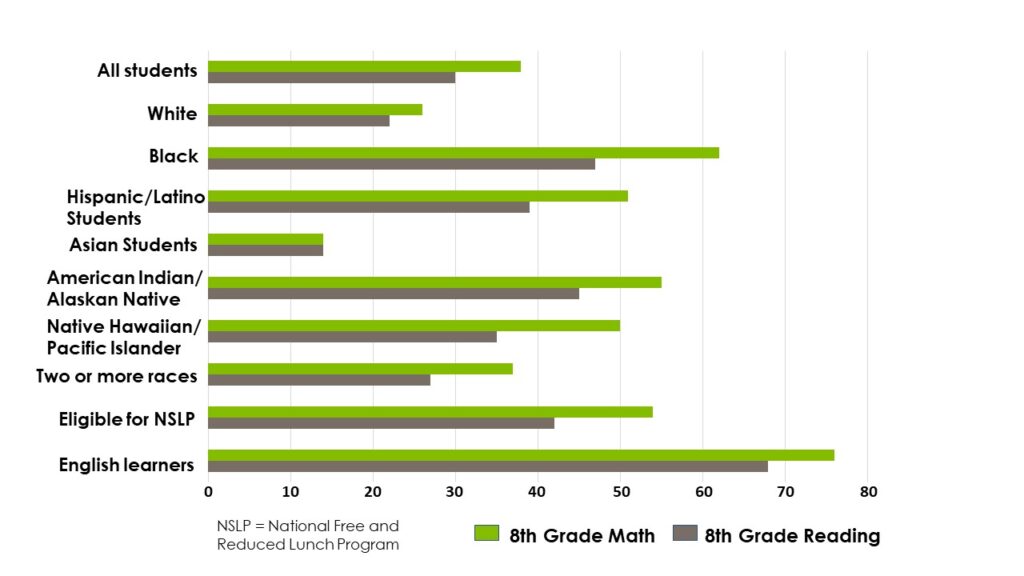
This is a horizontal bar graph that shows the percent of student groups who scored below the NAEP Basic achievement level in eighth grade math and reading.
What’s Next?
While announcing the NAEP findings last week, National Center for Education Statistics Commissioner Peggy Carr called the results a defining moment for education. These results, while sobering, are only a piece of the puzzle in finding ways to accelerate learning for students who experienced the pandemic with a multitude of backgrounds, environments and experiences.
State policymakers have already been pursuing solutions to address interrupted learning, and many have leveraged resources available through the American Rescue Plan’s Elementary and Secondary School Emergency Relief Fund. To bridge gaps and promote recovery, these drastic and pervasive decline require intensive interventions and robust systems of support for students, teachers and families.