
The COVID-19 pandemic has disrupted traditional forms of education and continues to create challenges for school systems and the students they serve. Education leaders and teachers have the unenviable responsibility of making difficult decisions well into the 2020-21 school year and beyond.
In the spring, NWEA released a set of projections of the potential academic impact of COVID-19 disruptions modeled on well-documented summer learning loss estimates. Now, with fall data in hand, NWEA is ready to share some key findings and actionable takeaways from recent research based on a sample of more than 8,000 schools across the nation.
About the Study
This research focused on exploring how school shutdowns impacted student achievement at the start of the 2020-21 academic year. Using data from nearly 4.4 million students in grades 3-8 who took MAP® Growth™ in fall 2020, NWEA examined the following research questions:
-
- How did students perform this fall relative to a typical school year (specifically, fall 2019)?
- How has student growth changed since schools physically closed in March 2020?
Key Findings
Initial findings are optimistic for reading, suggest unfinished learning in math and raise equity concerns about missing data on students from underserved communities. More specifically, our research scientists found three key takeaways:
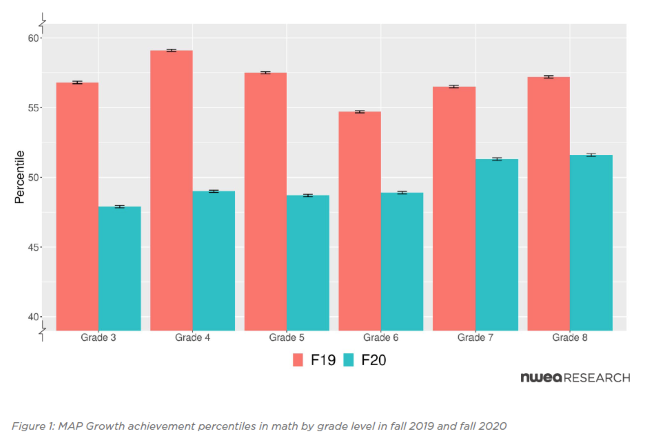
- In fall of 2020, students in grades 3-8 performed similarly in reading to same-grade students in fall 2019, but about 5-10 percentile points lower in math.
- Most students showed growth in both reading and math achievement since the onset of COVID-19 disruptions, but growth in math was lower than in a typical year.
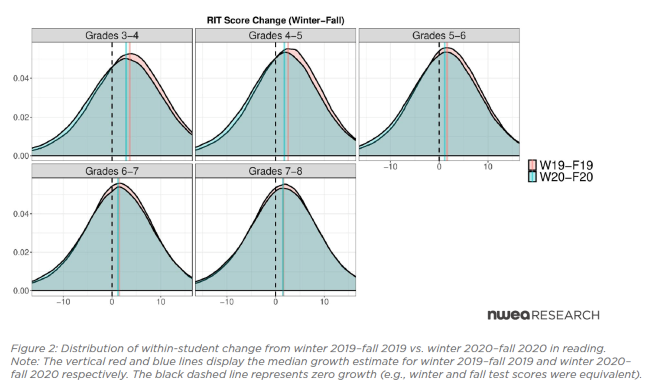
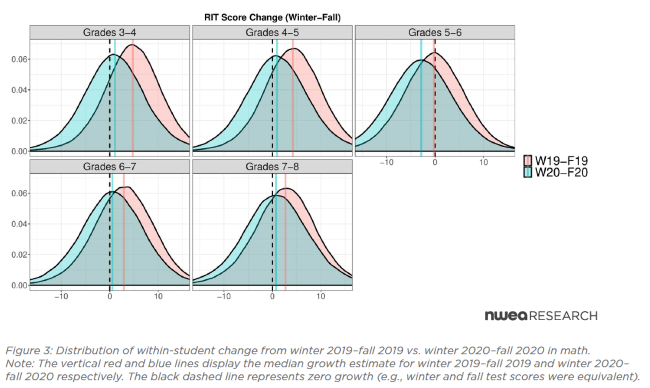
Note: In both charts, vertical red and blue lines display the median growth estimate for winter 2019-fall 2019 and winter 2020-fall 2020, respectively. The black dashed line represents zero growth (e.g., winter and fall test scores were equivalent).
- Some differences by racial/ethnic groups are emerging in the fall 2020 data, but it is too early to draw definitive conclusions from these initial results. Student groups especially vulnerable to the impacts of the pandemic were more likely to be missing from our fall 2020 data.
Considerations for Policymakers
Based on the data, NWEA has four considerations for policymakers to support student learning:
- Ensure equitable funding to mitigate disproportionate educational impacts on underserved students. Federal and state leaders must continue to provide funding to facilitate the safe return to all classrooms and the interventions needed for recovery, with greater investment in students who have gone “off the grid” and flexibility in the use of funds to allow communities to make decisions based on local needs. Across grades and subjects, students who have lower achievement, students of color, and schools with higher concentrations of socioeconomically disadvantaged students were less likely to test this fall compared to last year.
- Advocate for the collection of data illustrating how students are performing academically, with a focus on informing support and resource allocation vs. accountability. This study only scratches the surface in measuring the impacts of COVID-19. Informal district assessments administered during the school year as well as statewide summative tests this spring will help states and districts understand whether trends in our national research are reflective of their students and show where resources are most needed. For data to be used productively, policies should support the decoupling of assessment from high stakes purposes such as school ratings and teacher evaluation in spring 2021 and support flexibility in testing.
- Support efforts to understand impacts on subgroups and context on students’ opportunity to learn. When interpreting data to inform next steps for schools and students, information on who is not represented in the data collected is critical to consider, as are non-academic indicators such as access to broadband/technology, attendance and completion of assignments. This information can support educational leaders in best targeting resources to those most in need and is important to accurate interpretation of achievement data. Policymakers can partner closely with state and district leaders and the broader community to understand local needs without creating undue burden on educators and families by adding too many layers of data collection.
- Double-down on investments in high-quality math teaching and learning. Policymakers can pay attention to the differential impacts of the pandemic on math achievement and the variability in learning level that teachers are likely to encounter. For example, the National Council of Teachers of Mathematics encourages creative decisions about how students are organized for instruction, maintaining high expectations for learning, providing differentiated support for each student, and allowing students to move in and out of flexible interventions as needed.